This article explains how to access and read your financial information. Users can access Quiver Finances to view both estimated and final sales and payment information.
Log into Quiver with an active username and password.

-----
Quiver Finances is broken into 2 sections:
This section displays Quiver's payment information. From here, users can see what revenue Quiver has already disbursed, and what revenue is still processing.

The widget at the top of the page displays Quiver's payment data based on what payments have already been disbursed and what payments are still processing.

- Total Earned: The total net sales that Quiver has received from all retailers that are due to you, the Quiver client.
- Total Net Paid: The total amount that Quiver has already paid you, the Quiver client.
- Total Deductions: The amount that Quiver keeps from the "Total Earned" to cover certain expenses. These deductions occur when:
- A Quiver user has a special contract that includes revenue share, or
- A Quiver client chooses certain reimbursement options (e.g. Check, Wire Transfer).
- Total Outstanding: The amount that Quiver has yet to pay you, the Quiver client.
- "Total Earned" - "Total Net Paid" - "Total Deductions" = "Total Outstanding"
- Total Titles - The total number of unique titles distributed through Quiver.
- Avg. Earnings/Title - The average revenue from sales of all titles distributed through Quiver.
-----
The tool provides several filters to help navigate through the Financial information on this page.

- Show Earnings Made in - Filter earnings by date. Options include:
- Last Month Received (default)
- Last 6 Months Received
- 2016
- 2015
- All Time
- Earned Revenue - Filter earnings by a specific dollar amount or price range. Options include:
- Less than
- More than
- Equal to
Once finished adding filters, click  . Afterward, there are two ways to navigate through the payment data:
1. Click the desired data parameters above the table.
By default, the table displays the total # of transactions and earned revenue by date.

Click "Title" to display the total # of transactions and earned revenue by title.

Click "Retailer" to display the total # of transactions and earned revenue by retailer.

Click "Payments" to display the gross amount, deductions, net amount, and transaction # of each payment a user has already received.

2. Navigate through the table by clicking the desired data point to expand.
By default, the table displays the total # of transactions and earned revenue by date.
Click on a date to expand the title list for that date.

Click on a title to expand the retailer list for that title.

Click on a retailer to expand the transaction list for that retailer.


-----
To download a spreadsheet with all filtered payment information, click  below the table.

iTunes Estimated Sales - Daily
This section displays the estimated net revenue from iTunes sales and rentals. Once a title is available for sale and/or rental on the iTunes store estimated sales for each day will be displayed here.

Please Note: It takes 24 hours for a day's estimated iTunes sales to appear.
The widget at the top of the page displays both the running estimated revenue for all iTunes sales and the total # of titles included in the estimated revenue calculation.

- Total Revenue - Net revenue for all titles sold/rented on iTunes
- Total Titles - Total # of titles included in the total revenue calculation
This section displays estimated iTunes revenue breakdowns by date and title.

To access data for Daily Sales / Title Sales, add desired filters and click . It's also possible to access this section by simply clicking without setting any search parameters.

By default, the site displays the current month's estimates (unless a date range was selected in the search parameters).

To view iTunes estimated sales within a different date range, click the desired range.
It's possible to see sales estimate breakdowns by:
- All-time
- Week
- Month
- Quarter
- Year
- Custom (user must specify a date range)
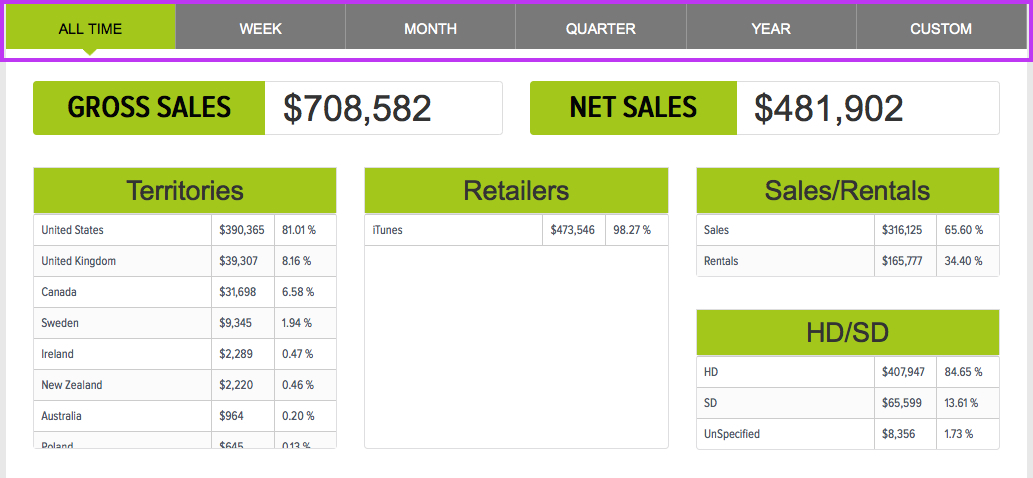
Each date range displays its unique gross sales and net sales.

- Gross Sales - The total revenue earned from iTunes sales/rentals based on the retail price charged for each transaction.
- Net Sales - The revenue that a content owner will receive after iTunes take their cut (this is the amount Quiver returns to you).
Each breakdown also displays its unique territories, transaction types (Sales, Rentals), and transaction resolutions (HD, SD, Unspecified).

The Daily Sales Graph displays net sales for all titles. The x-axis represents dates and the y-axis represents sales (in US dollars). The graph defaults to a line chart, but users can also see data in a bar graph.

Mouse over the graph to view more information about each bar or line node. Use the mouse scroll ability to zoom in/out of the graph; click and drag the graph left/right to move through the graph's timeline.
To download a daily revenue CSV, click  below the Daily Sales graph.

The Title Sales Table displays sales breakdowns by title.

The table can be sorted by:
- Title - The title of the film.
- Transactions - The total # of times a title was bought and/or rented.
- Total Gross Sales - The total revenue earned from iTunes for a title based on the retail price charged for each transaction.
- Total Net Sales - The revenue for a title that a content owner will receive after iTunes take their cut (this is what Quiver returns to you).
- Gross EST Sales - The total revenue earned by iTunes for a title based on the retail price charged for each EST transaction.
- Gross VOD Sales - The total revenue earned by iTunes for a title based on the retail price charged for each VOD transaction.
- Net EST Sales - The revenue for a title's EST sales that a content owner will receive after iTunes take their cut (this is what Quiver returns to you).
- Net VOD Sales - The revenue for a title's VOD sales that a content owner will receive after iTunes take their cut (this is what Quiver returns to you).
To download a title sales CSV, click  below the Title Sales table.
